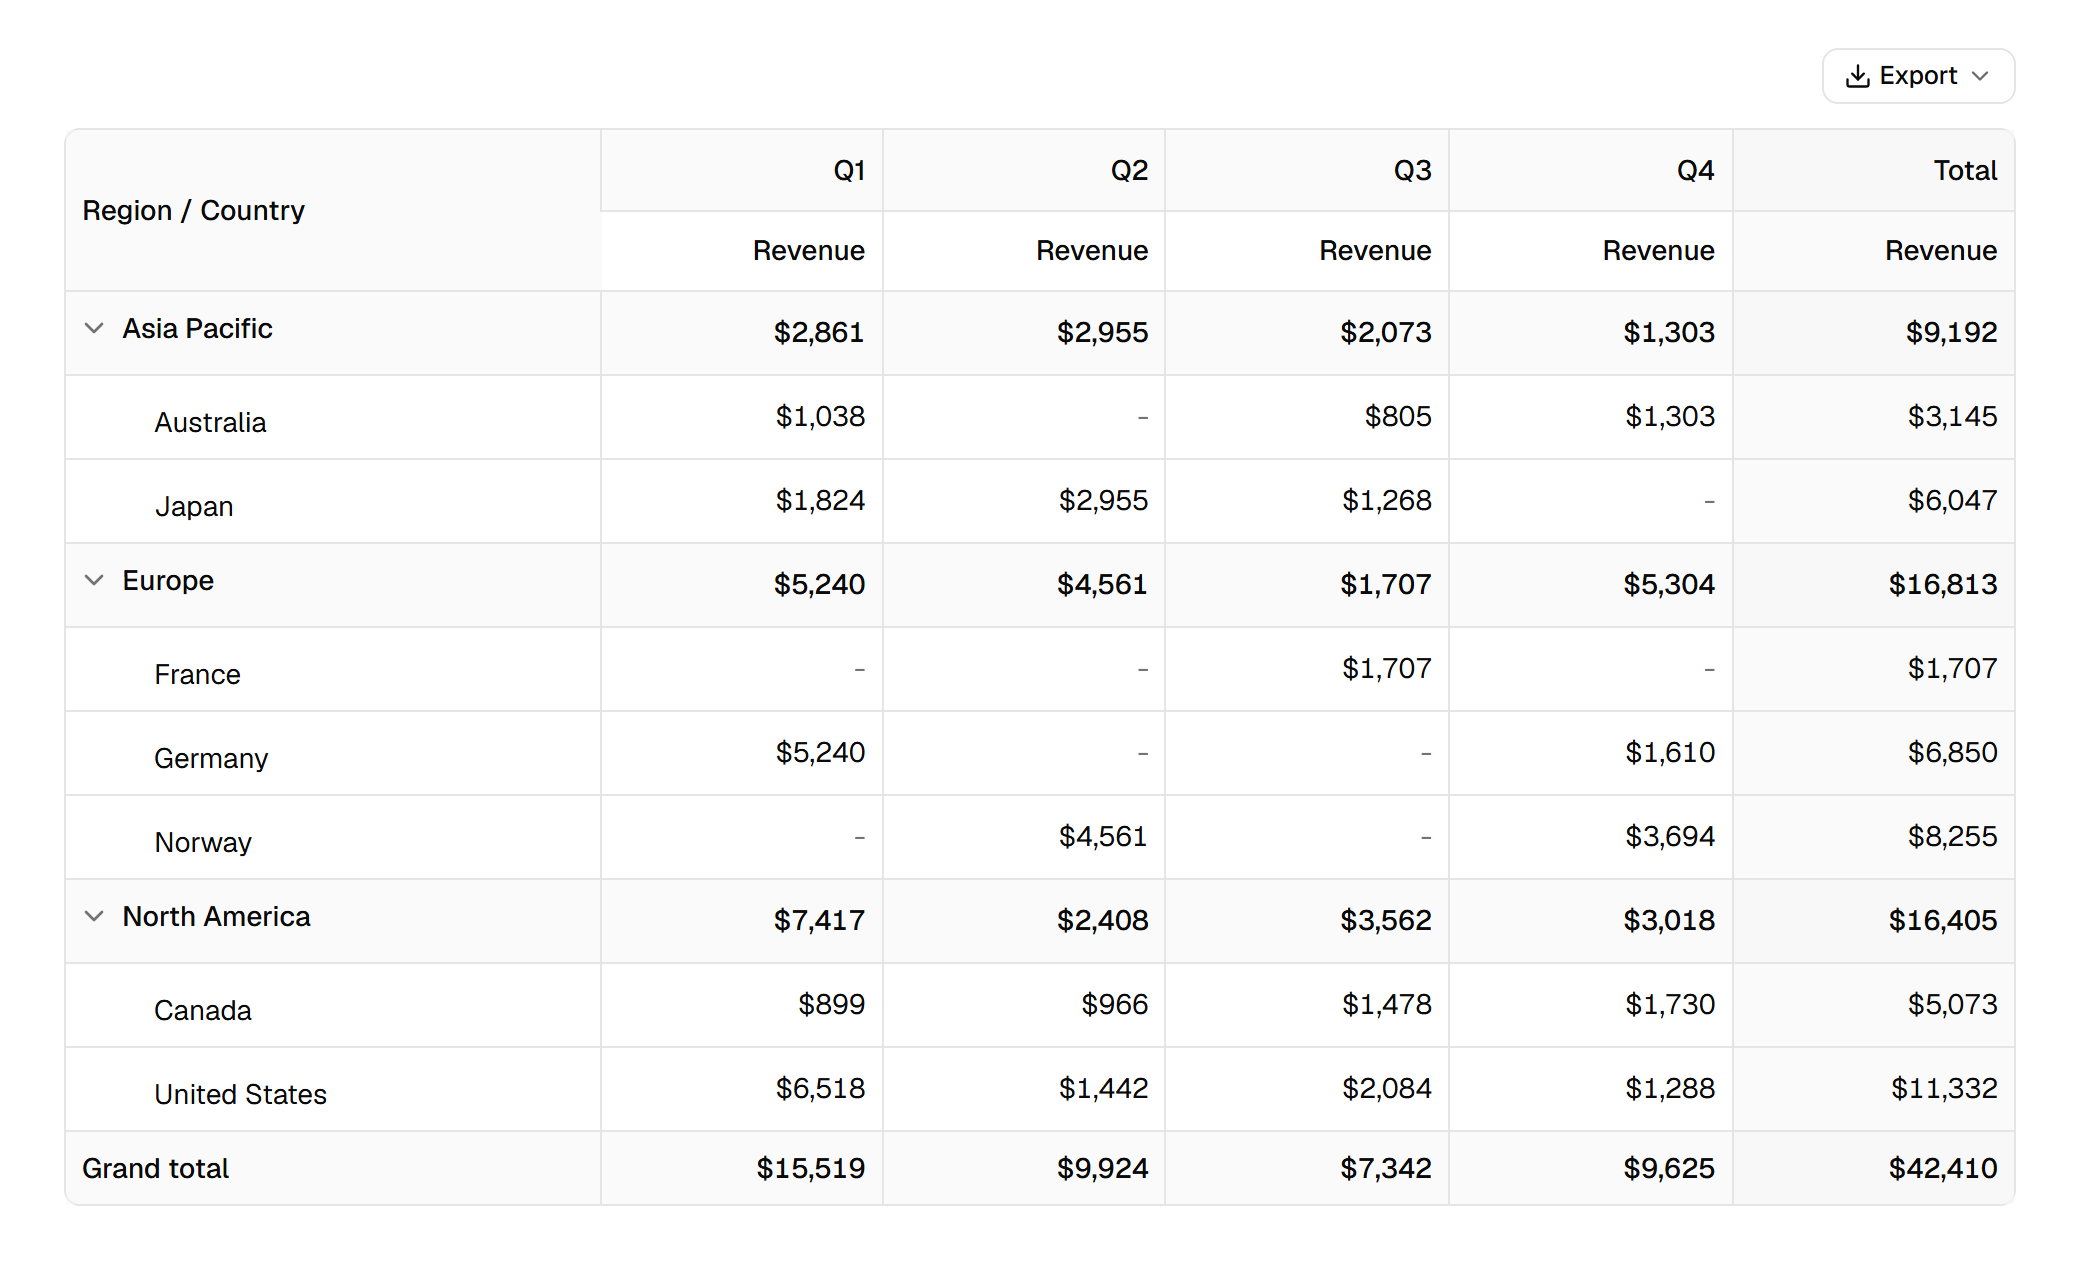
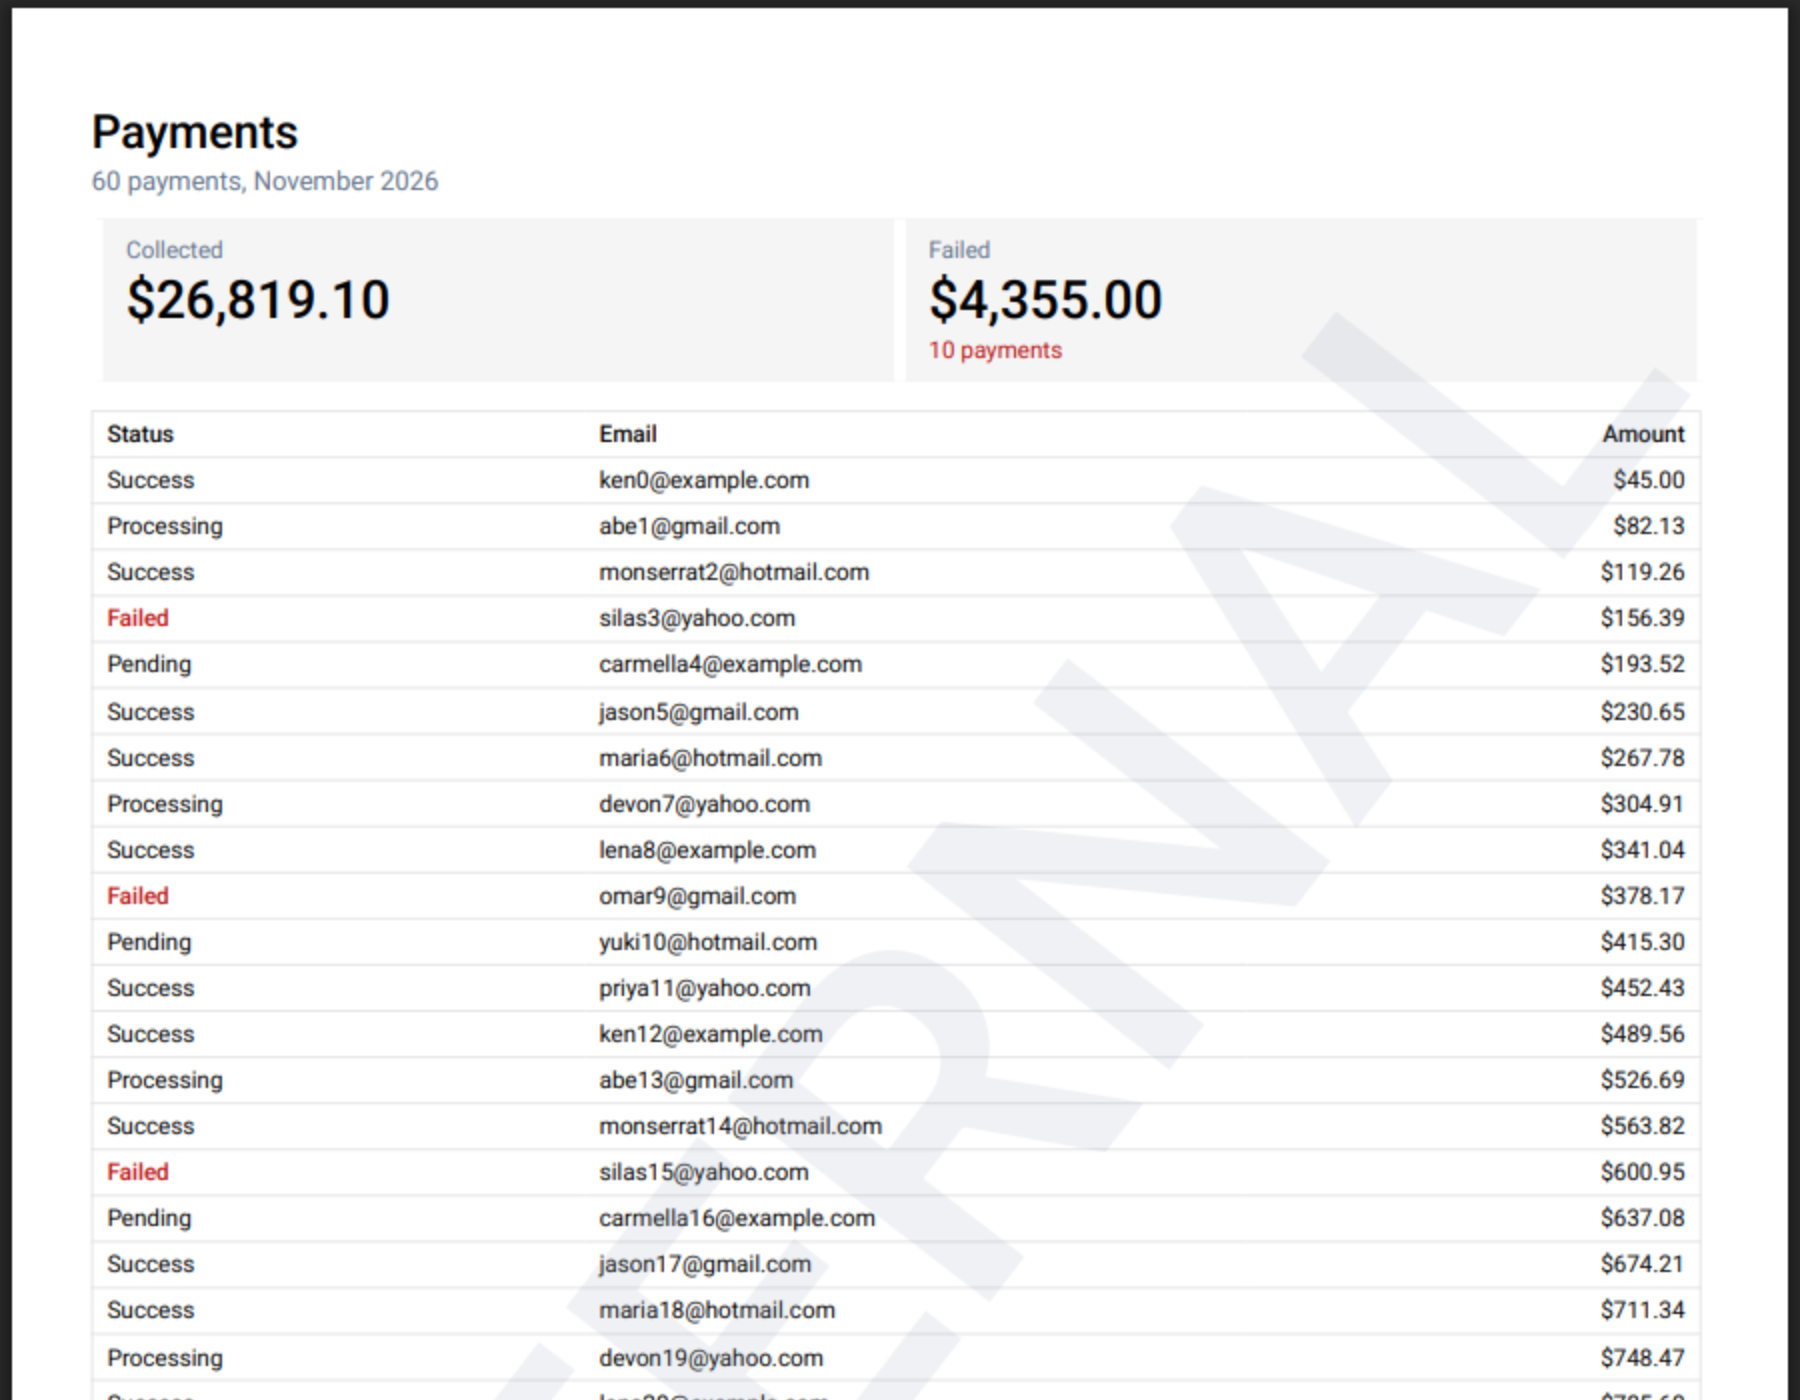
Export TanStack Table to Excel with grouped rows
Group a TanStack Table by two columns and export it to a real .xlsx file where the groups are Excel outline levels and the group totals are SUBTOTAL formulas.
A grouped TanStack table is easy to read on screen: regions, products under them, a total on each group row. Export it with a CSV button and all of that is gone. The file has flat rows, no totals, and amounts stored as text.
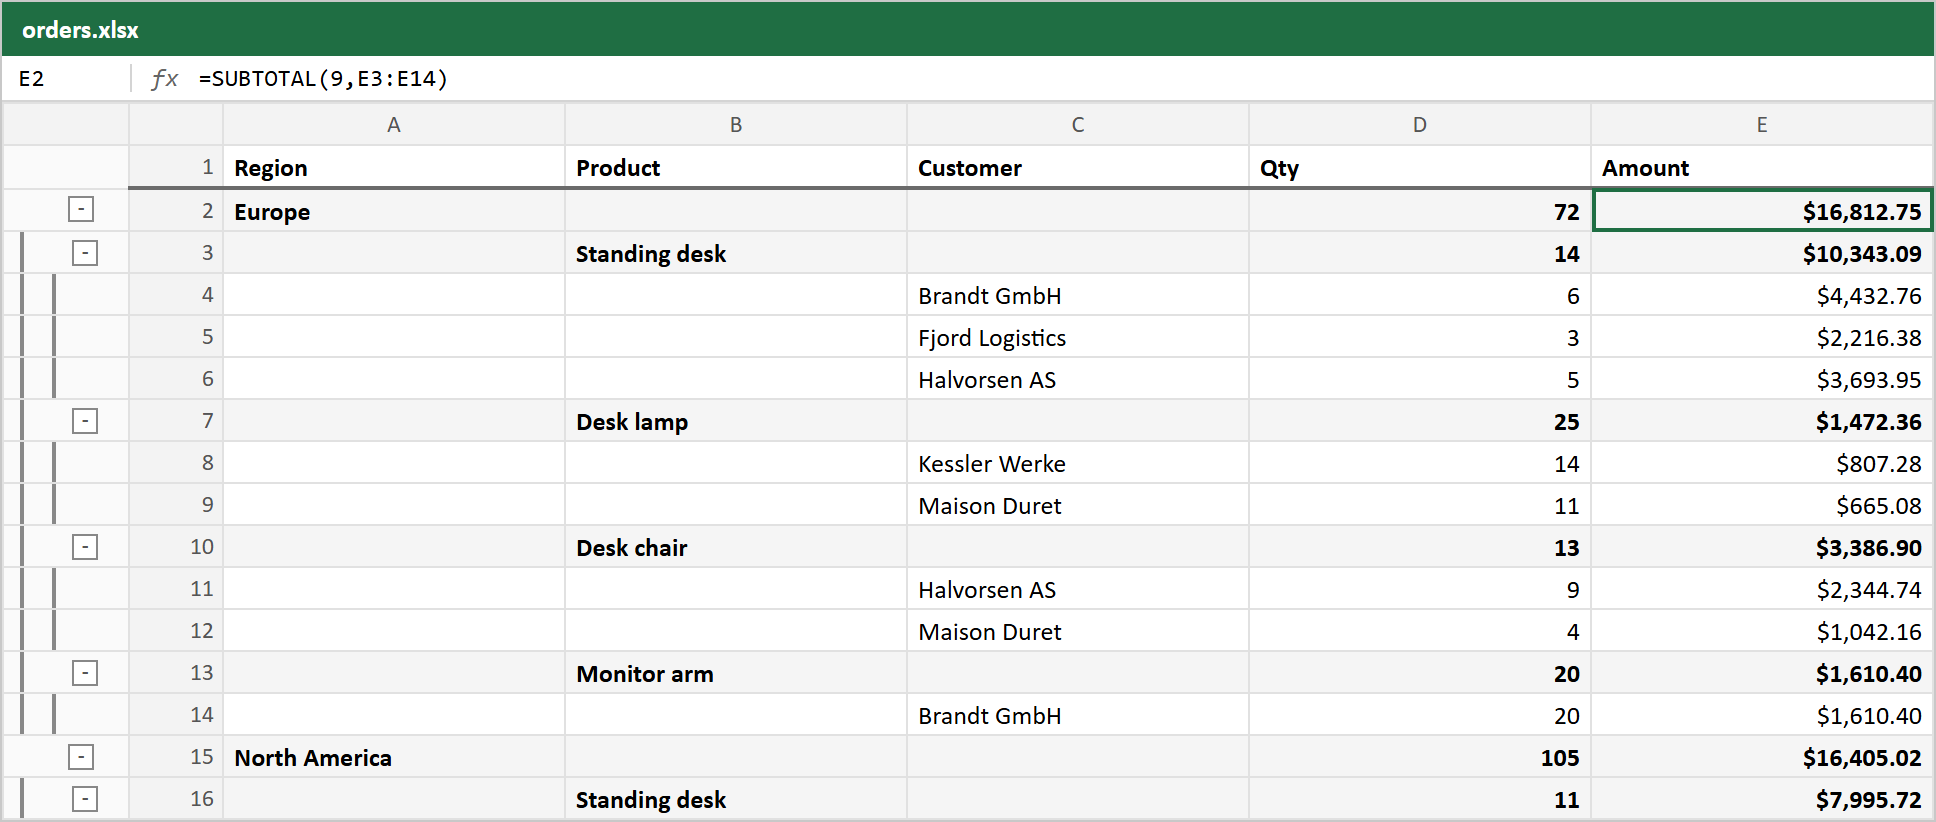
This guide builds a table grouped by region and product, adds an Export menu, and gets you an Excel file that keeps the structure:
- each grouping level is an Excel outline level, so users collapse a region with Excel's own buttons;
- group totals are
SUBTOTALformulas, so they update when someone edits a number; - amounts stay numbers with a currency format, so they sort and sum.
The code uses TanStack Table v9 and shadcn/ui. The last section shows the v8 version.
Install#
You need a React project with shadcn/ui and TanStack Table. Rowpine is the package that reads the table and writes the file; the export menu is a shadcn registry item, so its source lands in your project.
npm install rowpine @tanstack/react-table
npx shadcn add table
npx shadcn add https://rowpine.com/r/export-menu.json
The data#
Any array of objects works. This guide uses orders with a region, a product, a customer, a quantity and an amount:
export type Order = {
  id: string
  region: string
  country: string
  customer: string
  product: string
  quarter: string
  quantity: number
  amount: number
}

export const orders: Order[] = [
  { id: "1001", region: "Europe", country: "Germany", customer: "Brandt GmbH", product: "Standing desk", quarter: "Q1", quantity: 6, amount: 4432.76 },
  { id: "1002", region: "Europe", country: "Germany", customer: "Kessler Werke", product: "Desk lamp", quarter: "Q1", quantity: 14, amount: 807.28 },
  // ...
]
Register the grouping features#
TanStack Table v9 only includes the features you register. Grouping needs three of them: columnGroupingFeature to group, rowAggregationFeature to compute the group totals, and rowExpandingFeature with the expanded row model to show the rows under each group. columnVisibilityFeature gives rows getVisibleCells() for rendering.
import {
  aggregationFn_sum,
  columnGroupingFeature,
  columnVisibilityFeature,
  createColumnHelper,
  createExpandedRowModel,
  createGroupedRowModel,
  metaHelper,
  rowAggregationFeature,
  rowExpandingFeature,
  tableFeatures,
  useTable,
} from "@tanstack/react-table"
import { ChevronDown, ChevronRight } from "lucide-react"
import type { RowpineColumnMeta } from "rowpine"

import { ExportMenu } from "@/components/export-menu"
import {
  Table,
  TableBody,
  TableCell,
  TableHead,
  TableHeader,
  TableRow,
} from "@/components/ui/table"
import { orders, type Order } from "./orders"const features = tableFeatures({
columnVisibilityFeature,
columnGroupingFeature,
rowAggregationFeature,
rowExpandingFeature,
groupedRowModel: createGroupedRowModel(),
expandedRowModel: createExpandedRowModel(),
aggregationFns: { sum: aggregationFn_sum },
// Types `meta.rowpine` on your columns.
columnMeta: metaHelper<{ rowpine?: RowpineColumnMeta<Order> }>(),
})The last line, columnMeta, is optional. It types meta.rowpine on your columns, where Rowpine reads its export settings.
Define columns with aggregations#
A column's aggregationFn decides what its group rows show. Rowpine turns it into the matching Excel function, so the file computes the same total the screen shows:
const usd = new Intl.NumberFormat("en-US", { style: "currency", currency: "USD" })
const helper = createColumnHelper<typeof features, Order>()

const columns = helper.columns([
  helper.accessor("region", { header: "Region" }),
  helper.accessor("product", { header: "Product" }),
  helper.accessor("customer", { header: "Customer" }),
  helper.accessor("quantity", { header: "Qty", aggregationFn: "sum" }),
  helper.accessor("amount", {
    header: "Amount",
    aggregationFn: "sum",
    cell: (c) => usd.format(c.getValue()),
    aggregatedCell: (c) => usd.format(c.getValue() as number),
    // An Excel number format: the cell stays a number, shown as dollars.
    meta: { rowpine: { numFmt: '"$"#,##0.00' } },
  }),
])
aggregationFn |
Formula in Excel |
|---|---|
sum |
SUBTOTAL(9, ...) |
mean |
SUBTOTAL(1, ...) |
min |
SUBTOTAL(5, ...) |
max |
SUBTOTAL(4, ...) |
| anything else | the value TanStack computed |
numFmt is an Excel number format. The cell holds the number 4432.76 and Excel shows $4,432.76. Without it, the number is written plain; it is still a number either way, so it sorts and sums.
Group the table and add the menu#
initialState.grouping sets the grouping columns, outermost first. expanded: true opens every group. The export menu takes the table instance and nothing else:
export function OrdersTable() {
  const table = useTable({
    features,
    columns,
    data: orders,
    initialState: { grouping: ["region", "product"], expanded: true },
  })

  return (
    <div className="grid gap-3">
      <div className="flex justify-end">
        <ExportMenu table={table} fileName="orders" pdfTitle="Orders" />
      </div>
      <div className="rounded-md border">
        <Table>
          <TableHeader>
            {table.getHeaderGroups().map((group) => (
              <TableRow key={group.id}>
                {group.headers.map((header) => (
                  <TableHead key={header.id}>
                    <table.FlexRender header={header} />
                  </TableHead>
                ))}
              </TableRow>
            ))}
          </TableHeader>
          <TableBody>
            {table.getRowModel().rows.map((row) => (
              <TableRow key={row.id} className={row.getIsGrouped() ? "bg-muted/50 font-medium" : undefined}>
                {row.getVisibleCells().map((cell) => (
                  <TableCell key={cell.id}>
                    {cell.getIsGrouped() ? (
                      <button type="button" onClick={row.getToggleExpandedHandler()} className="inline-flex items-center gap-1">
                        {row.getIsExpanded() ? <ChevronDown className="size-4" /> : <ChevronRight className="size-4" />}
                        <table.FlexRender cell={cell} /> ({row.subRows.length})
                      </button>
                    ) : cell.getIsPlaceholder() ? null : (
                      <table.FlexRender cell={cell} />
                    )}
                  </TableCell>
                ))}
              </TableRow>
            ))}
          </TableBody>
        </Table>
      </div>
    </div>
  )
}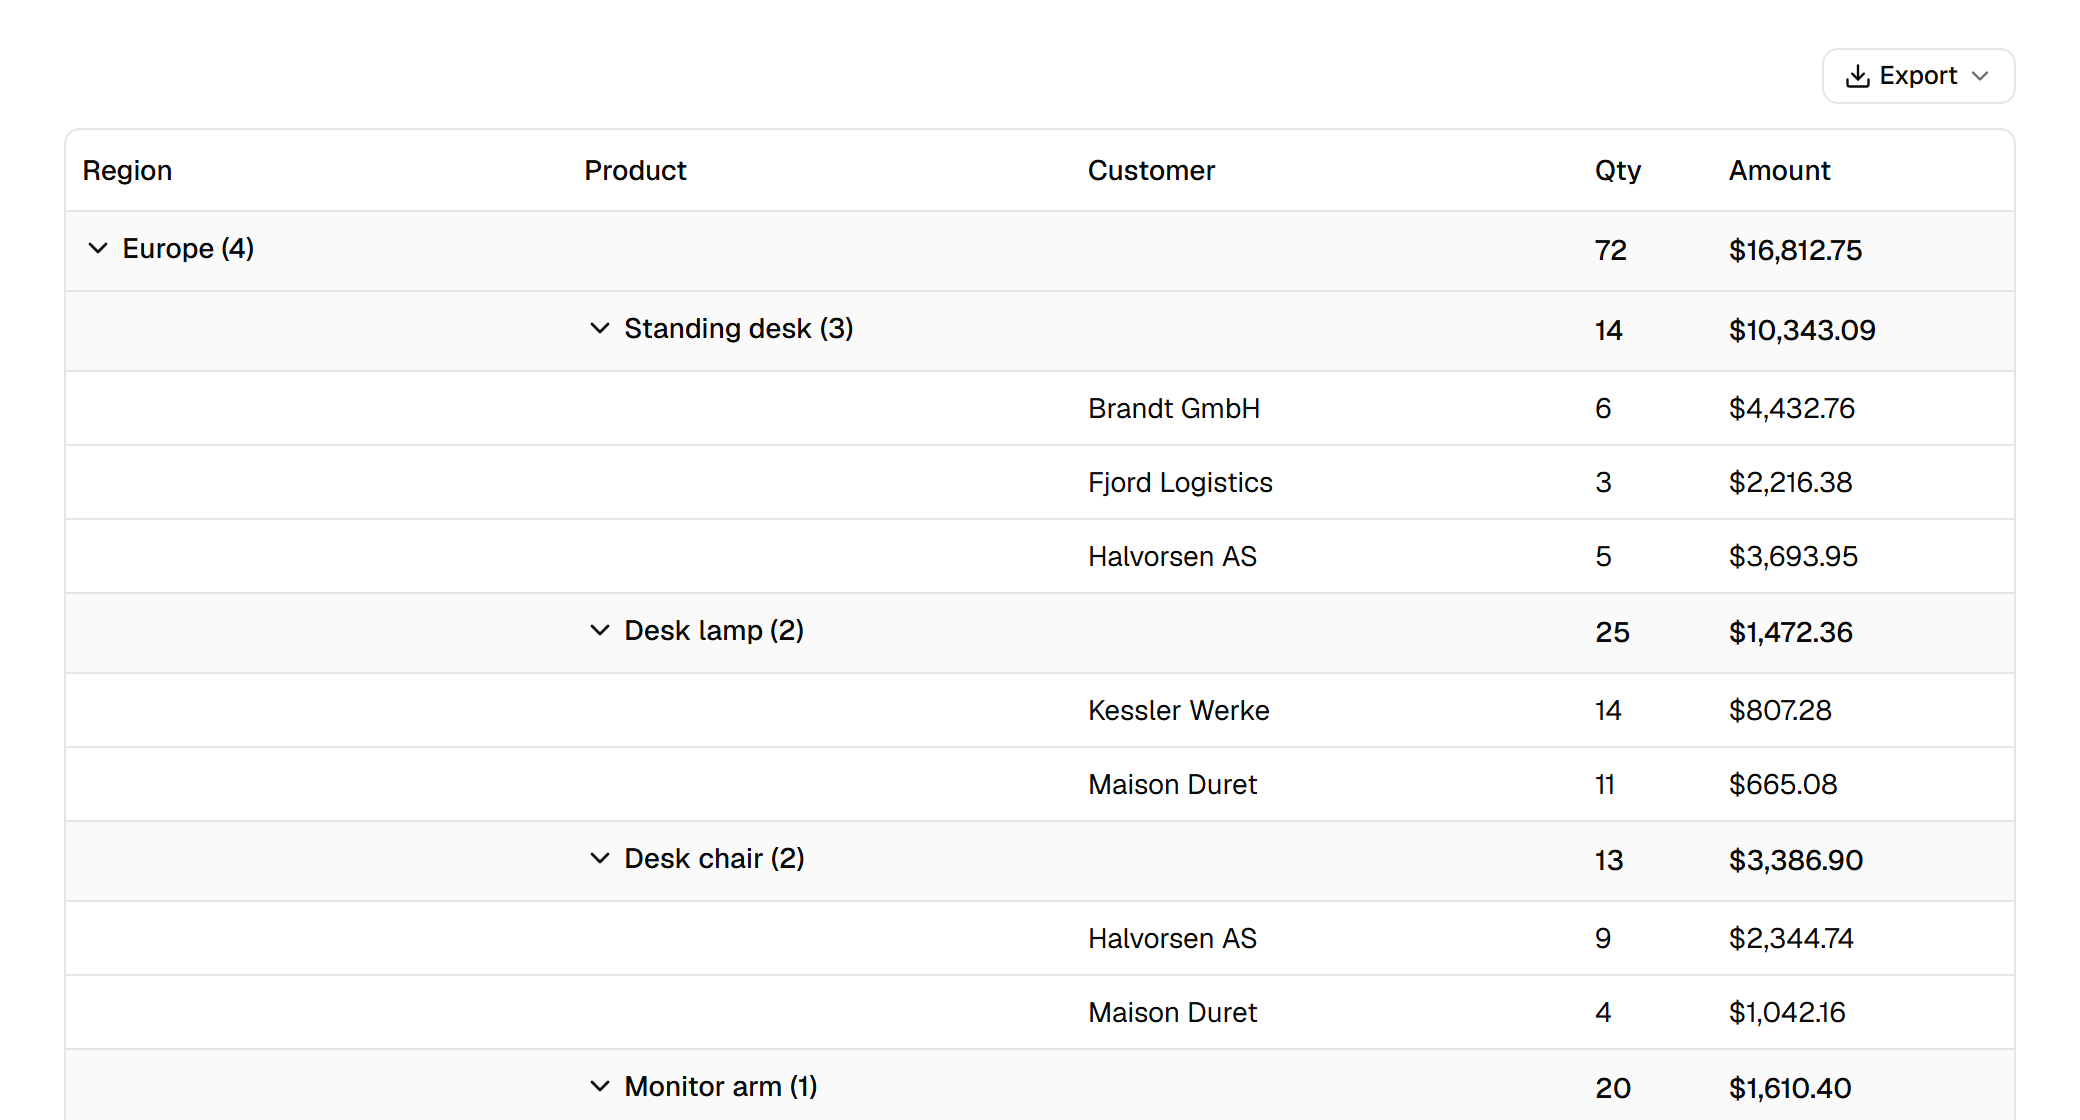
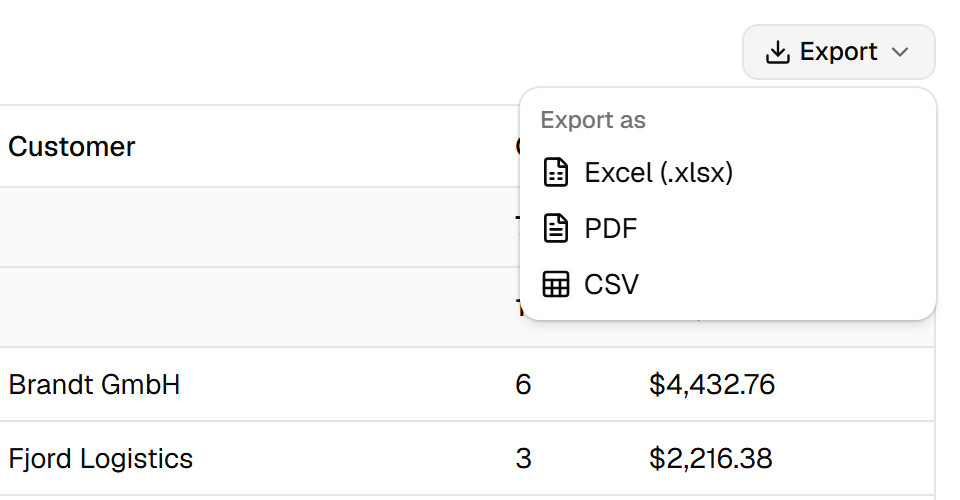
The menu offers Excel, PDF and CSV. Pick Excel and the browser saves orders.xlsx.
What lands in the file#
Open the file in Excel:
- Outline levels. The rows under each region are at outline level 1 and the orders under each product at level 2. Excel draws the bars and minus buttons on the left; clicking one collapses the group.
- Group rows above their rows, bold, on a light fill, as on screen. A grouped-by value appears once, on its group row, so the order rows leave the Region and Product cells empty.
- Formulas, not pasted numbers. Europe's amount is
=SUBTOTAL(9,E3:E14). The range includes the product group rows inside Europe, andSUBTOTALskips otherSUBTOTALcells, so nothing is counted twice. Each formula is saved with its result, so previews that do not recalculate still show the right total. - Every row. The file holds every row that passes the table's filters, in the current sort, on every page. Groups collapsed on screen are exported in full; collapsing is a view setting, and the user can collapse them again in Excel.
The group totals in the file are computed by Excel from the rows below them. If your users edit a quantity or amount in the sheet, the region and product totals follow.
Export from your own button#
The menu is optional. exportXlsx takes the same table and returns a promise:
import { exportXlsx, type TableLike } from "rowpine"

import { Button } from "@/components/ui/button"

export function ExcelButton({ table }: { table: TableLike }) {
  return (
    <Button
      variant="outline"
      onClick={() => exportXlsx(table, { fileName: "orders", sheetName: "Orders" })}
    >
      Download Excel
    </Button>
  )
}
Useful options:
| Option | What it does |
|---|---|
fileName |
File name without the extension. |
sheetName |
Worksheet name. Default Sheet1. |
rows |
"all" (default), "page" for the current page only, or "selected" for selected rows. |
groupFill |
Fill color of the group rows. The export menu uses your theme's muted color. |
download |
false to get the Blob back without saving it, for example to upload it. |
TanStack Table v8#
Rowpine reads v8 tables too. The setup differs in two places: row models are table options, and column meta is typed through module augmentation.
import {
  createColumnHelper,
  getCoreRowModel,
  getExpandedRowModel,
  getGroupedRowModel,
  useReactTable,
  type RowData,
} from "@tanstack/react-table"
import type { RowpineColumnMeta } from "rowpine"

import { ExportMenu } from "@/components/export-menu"
import { orders, type Order } from "./orders"

// v8 types column meta through module augmentation.
declare module "@tanstack/react-table" {
  interface ColumnMeta<TData extends RowData, TValue> {
    rowpine?: RowpineColumnMeta<TData>
  }
}

const helper = createColumnHelper<Order>()
const columns = [
  helper.accessor("region", { header: "Region" }),
  helper.accessor("product", { header: "Product" }),
  helper.accessor("customer", { header: "Customer" }),
  helper.accessor("quantity", { header: "Qty", aggregationFn: "sum" }),
  helper.accessor("amount", {
    header: "Amount",
    aggregationFn: "sum",
    meta: { rowpine: { numFmt: '"$"#,##0.00' } },
  }),
]

export function OrdersTableV8() {
  const table = useReactTable({
    data: orders,
    columns,
    getCoreRowModel: getCoreRowModel(),
    getGroupedRowModel: getGroupedRowModel(),
    getExpandedRowModel: getExpandedRowModel(),
    initialState: { grouping: ["region", "product"], expanded: true },
  })

  return (
    <div>
      <ExportMenu table={table} fileName="orders" />
      {/* your table markup, unchanged */}
    </div>
  )
}
The file is the same: two outline levels and the same SUBTOTAL formulas.
When something looks wrong#
A group row has an empty cell where a total should be. The column has no numeric aggregationFn. Columns without one are left empty on group rows, the same as on screen.
The header in the file is a column id. The column's header is a function or JSX, which cannot be written to a file. Set meta.rowpine.header to the text you want.
A column should stay on screen only. Add meta: { rowpine: { exclude: true } } to it, for example an internal id. Checkbox and actions columns need nothing: columns without an accessor are left out on their own.
Dates are text in Excel. Only Date values become Excel dates. If your data has ISO strings, convert them in the accessor, accessorFn: (r) => new Date(r.date), and set numFmt: "yyyy-mm-dd".
License#
CSV export is free. Excel, PDF and pivot tables run without a key, with one notice line in each file; a license removes it and is a one-time payment per developer with a year of updates. The live Orders to Excel demo shows the same export with sorting, hidden columns and pinned columns.
Try it in your project
Everything runs without a license key; Excel and PDF files carry one notice line until you add one.