DocsPivot
Pivot designer
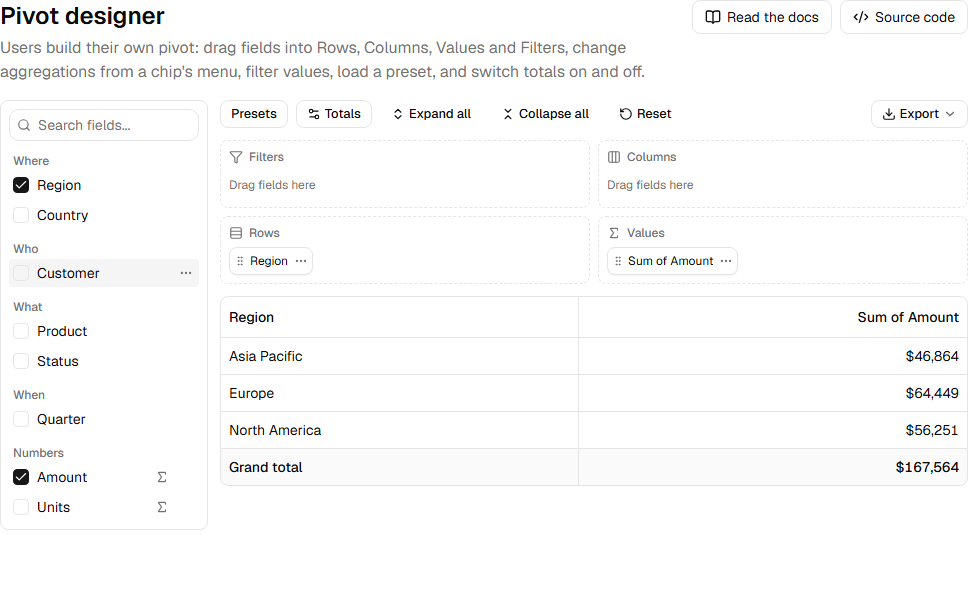
PivotDesigner lets users build the pivot themselves, the way they would in Excel: a field list on the left, four wells (Filters, Columns, Rows, Values) and the pivot under them.
import { PivotDesigner } from "@/components/pivot-designer"

const fields: PivotField<Order>[] = [
  { field: "region", label: "Region", kind: "dimension", group: "Where" },
  { field: "quarter", label: "Quarter", kind: "dimension", group: "When" },
  { field: "amount", label: "Amount", kind: "measure", format: usd },
]

<PivotDesigner
  data={orders}
  fields={fields}
  actions={(pivot) => <ExportMenu table={pivot.table} rowStyle={pivotRowStyle} />}
/>
A field's kind decides where it can go: a dimension goes to Rows, Columns or Filters, a measure to Values or Filters. group sorts the field list under headings; format formats a measure's values; defaultAgg sets the aggregation it gets in Values (default sum).
Props#
| Prop | What it does |
|---|---|
data, fields |
The rows and the fields users can pick. |
layout, onLayoutChange |
Control the layout. Without them the designer starts with the first dimension in Rows and the first measure in Values. |
presets |
Saved layouts in the Presets menu. |
aggregators |
Aggregations offered on value chips. Default all. |
pivotOptions |
{ numFmt }: an Excel number format for the value columns. |
actions |
Toolbar content given the current pivot, such as an export menu. |
onPivotChange |
Called with each new pivot. |
Was this page helpful?
Thanks. To tell us more, write to info@jqwidgets.com.