DocsPivot
Pivot tables
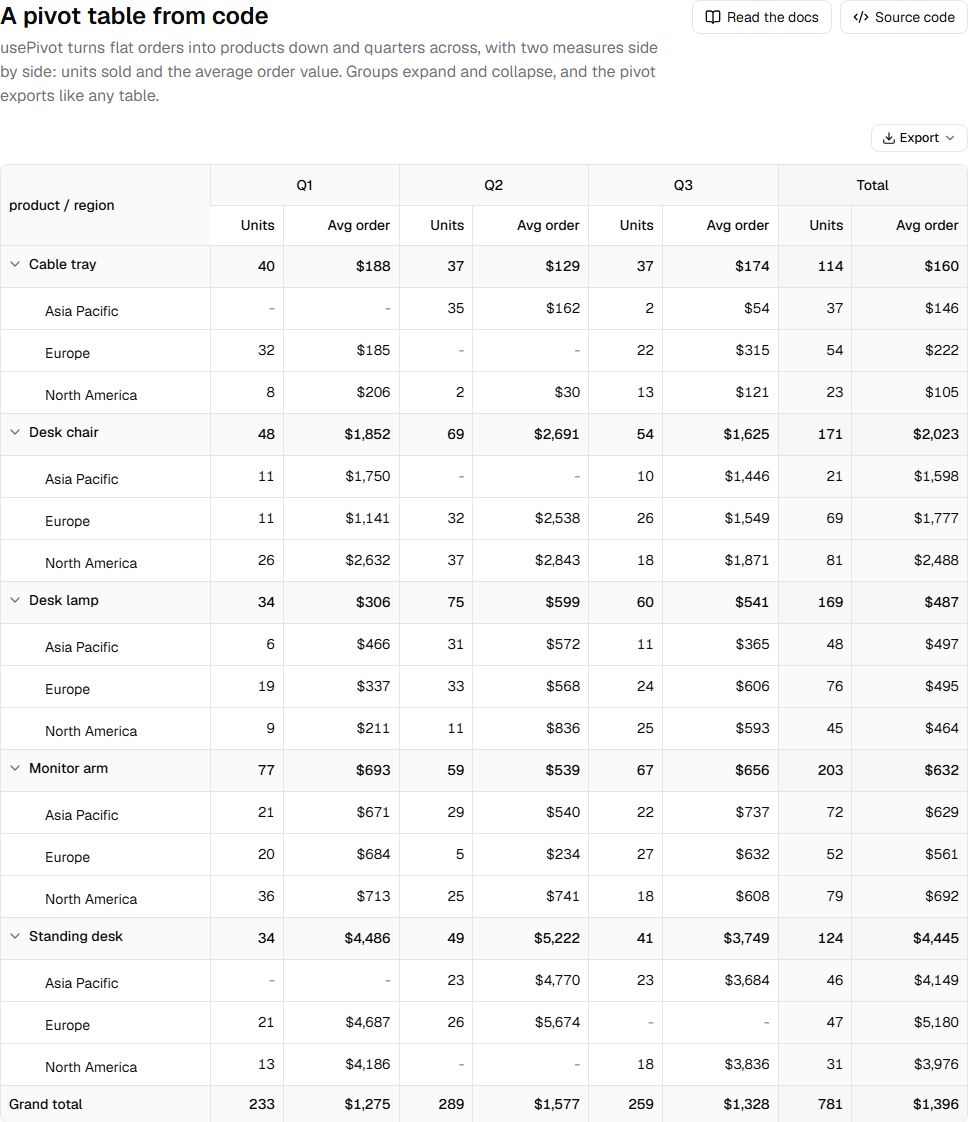
TanStack Table can group rows but has no pivot. Rowpine's pivot turns flat rows into a cross-tab: fields down the side, fields across the top, and aggregated values where they meet.
import { PivotTable, usePivot } from "@/components/pivot-table"

const config: PivotConfig<Order> = {
  rows: ["product", "region"],
  cols: ["quarter"],
  values: [
    { field: "quantity", agg: "sum", label: "Units" },
    { field: "amount", agg: "avg", label: "Avg order", format: usd },
  ],
}

const pivot = usePivot(orders, config)
<PivotTable pivot={pivot} />
Keep config stable (module scope or useMemo); usePivot recomputes when it changes.
Config#
| Key | What it does |
|---|---|
rows |
Fields down the side, outermost first. |
cols |
Fields across the top, outermost first. |
values |
Measures: field, agg, label, format. Several measures sit side by side. |
rowHeader |
Header of the first column. Default: the row fields joined with /. |
rowSubtotals |
Group rows carry subtotals. Default true. |
grandTotalRow, grandTotalCol |
Grand totals. Default true. |
rowSort, colSort |
(a, b, level) => number to order the values on an axis. Default: alphabetical, numbers in order. |
Without the registry component, createPivot(data, config) returns the same result: data (rows nested through subRows), columns (TanStack column definitions) and table (for exports). Render it with your own TanStack table if you prefer.
Was this page helpful?
Thanks. To tell us more, write to info@jqwidgets.com.